Tweet Sentiment Extraction - Start Blog
This kaggle competition aims to construct a language model that can not only identify the sentiment of a tweet but also understand why it is so. In other words, competitors are expected to figure out what word or phrase best supports the labeled sentiment.
With all of the tweets circulating every second it is hard to tell whether the sentiment behind a specific tweet will impact a company, or a person’s, brand for being viral (positive), or devastate profit because it strikes a negative tone. Capturing sentiment in language is important in these times where decisions and reactions are created and updated in seconds. But, which words actually lead to the sentiment description? In this competition you will need to pick out the part of the tweet (word or phrase) that reflects the sentiment.
This blog describes the background and motivation, dataset, evaluation metrics and exploratory data analysis (EDA).
Data set
Files
-
train.csv - the training set
-
test.csv - the test set
-
sample_submission.csv - a sample submission file in the correct format
Data format
Each row contains the text of a tweet and a sentiment label. In the training set you are provided with a word or phrase drawn from the tween selected_text that encapsulates the provided sentiment.
Columns
-
textID- unique ID for each piece of text -
textthe text of the tweet -
sentiment- the general sentiment of the tweet -
selected_text- [train only] the text that supports the tweet’s sentiment
Submission format
We are attempting to predict the word or phrase from the tweet that exemplifies the provided sentiment. The word or phrase should include all characters within that span (i.e. including commas, spaces, etc.). The format is as follows:
<id>, "<word or phrase that supports the sentiment>"
For example:
2, "Very good"
5, "I am neutral about this"
3, "Awful"
8, "If you say so!"
Evaluation metrics
The metric in this competition is the word-level Jaccard score. A good description of Jaccard similarity for strings is here. The formula is expressed as:
\begin{equation} score = \frac{1}{n} \sum_{i=1}^{n} jaccard(gt_i, dt_i) \end{equation}
where:
\[\begin{align*} n &= \textrm{number of documents} \\ jaccard &= \textrm{the function provided above} \\ gt_i &= \textrm{the ith ground truth} \\ dt_i &= \textrm{the ith prediction} \\ \end{align*}\]A python implementation of the jaccard score is as follows:
def jaccard(str1, str2):
    a = set(str1.lower().split())
    b = set(str2.lower().split())
    if (len(a)==0) & (len(b)==0): return 0.5
    c = a.intersection(b)
    return float(len(c)) / (len(a) + len(b) - len(c))
EDA
The EDA figures were retrieved from the kaggle kernel by MR_KNOWNNOTHING.
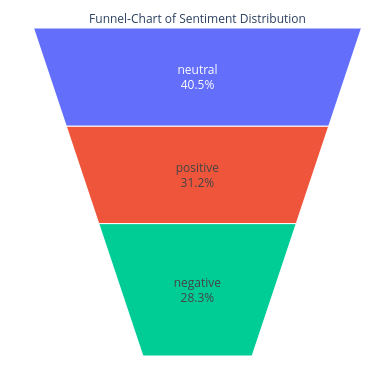
Data balance
The balance of the training set can be obtained with
import pandas as pd
import matplotlib.pyplot as plt
from plotly import graph_objs as go
train = pd.read_csv('/kaggle/input/tweet-sentiment-extraction/train.csv')
fig = go.Figure(go.Funnelarea(
    text =train.sentiment,
    values = train.text,
    title = {"position": "top center", "text": "Funnel-Chart of Sentiment Distribution"}
    ))
fig.show()

World Cloud
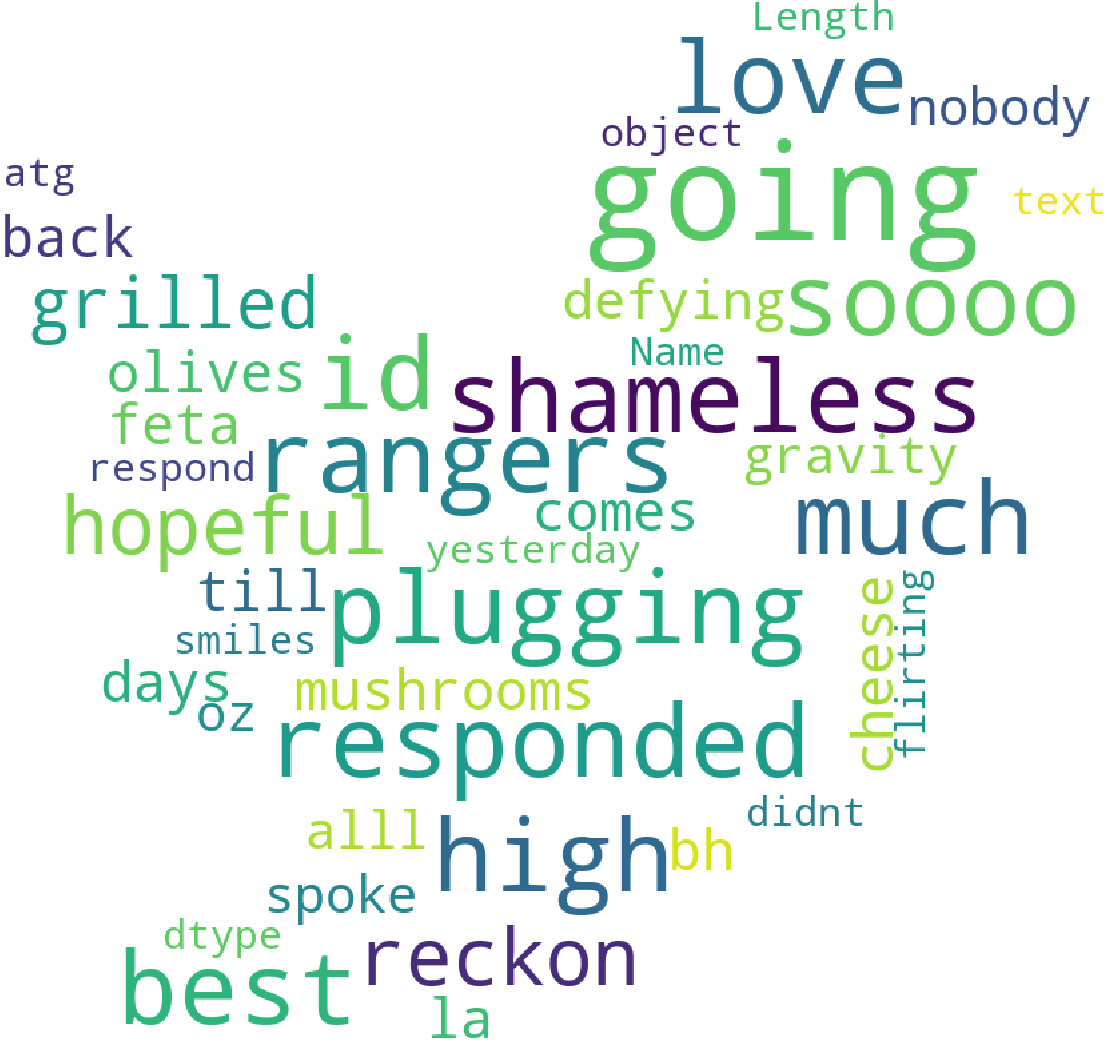
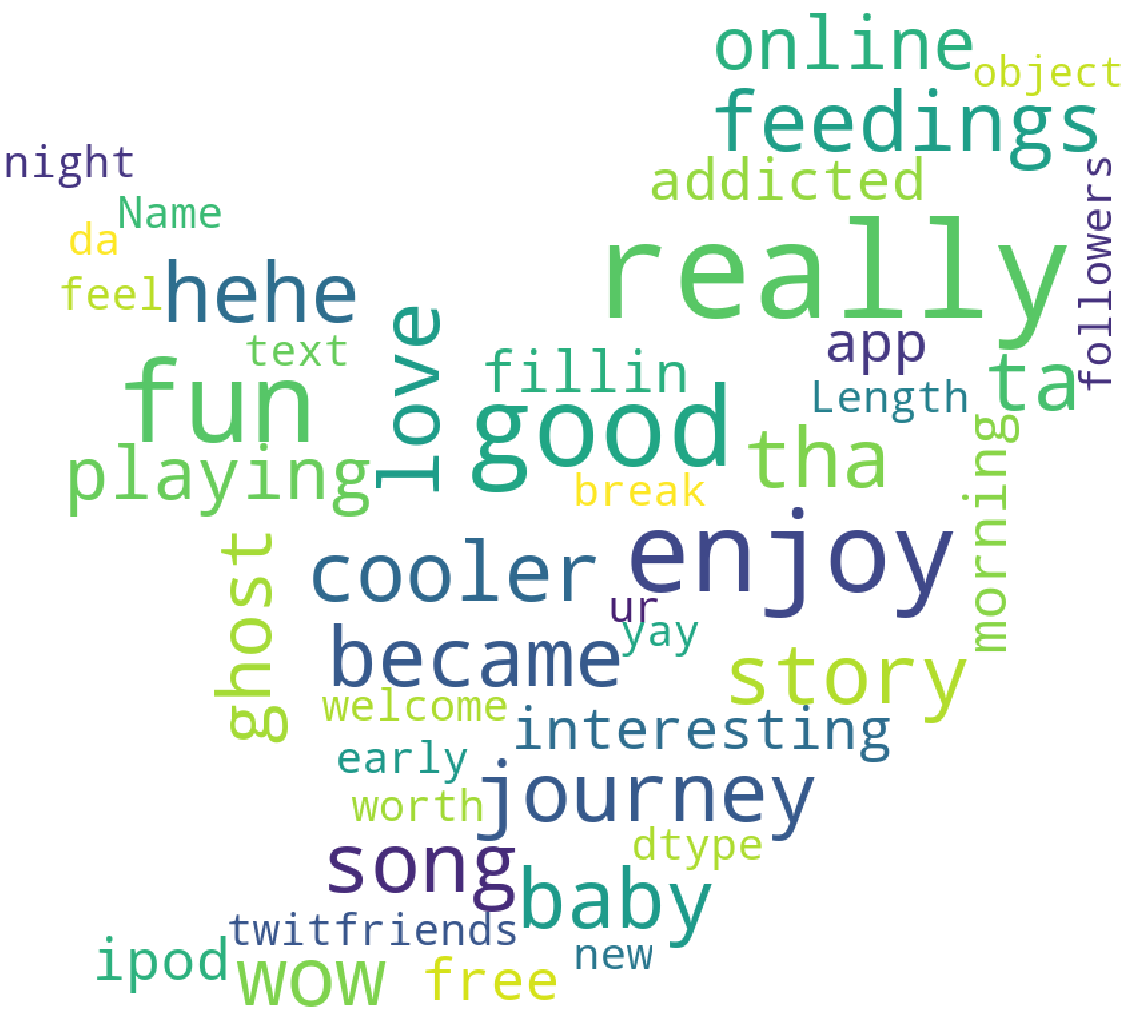
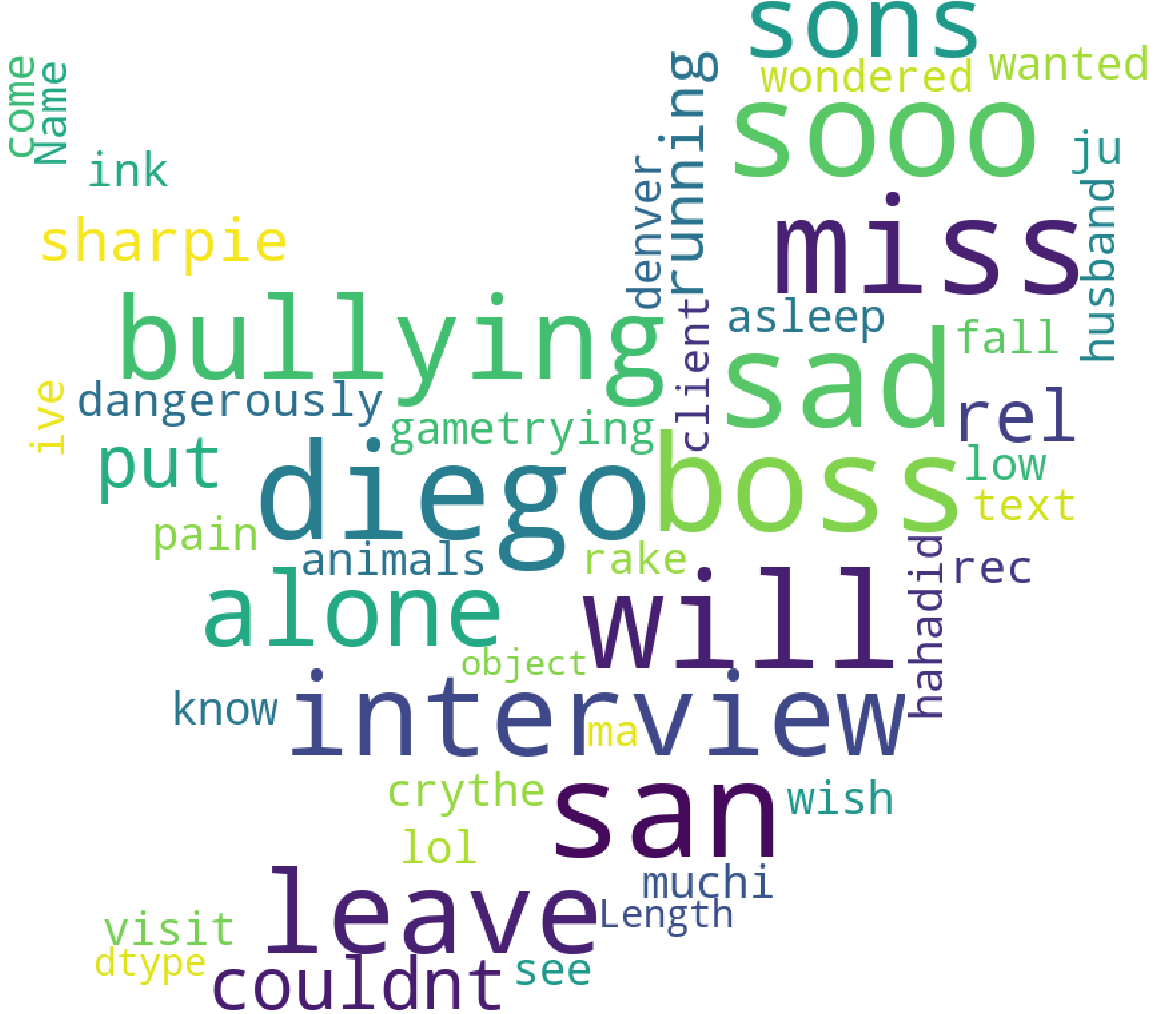
We use world clouds to show the most common words in the tweets based on their corresponding sentiment. The code is shown below:
from PIL import Image
from wordcloud import WordCloud, STOPWORDS, ImageColorGenerator
### mask for the lay-out of word cloud
d = '/kaggle/input/masks-for-wordclouds/'
pos_mask = np.array(Image.open(d+ 'twitter_mask.png'))
plot_wordcloud(Neutral_sent.text,mask=pos_mask,color='white',max_font_size=100,title_size=30,title="WordCloud of Neutral Tweets")
The plot_wordcloud function can be found in the kaggle kernel by aashita here.
World cloud of neural tweets:

World cloud of positive tweets:

World cloud of negative tweets:
