Course projects
A collection of data science course projects supported by Brown's open graduate education program
Open Graduate Education Program
The Open Graduate Education Program allows select Brown doctoral students to pursue a master’s degree in a secondary field. All doctoral students are invited to propose their own combination of studies, free of any disciplinary barrier.
I was blessed to participate in the Open graduate education program starting in 2019. I took this opportunity to pursue a secondary master’s degree in Data Science to extend research opportunities as my PhD research is highly multidisciplinary at the boundary between physical chemistry, machine learning and solid mechanics.
Course projects
Hands-on Data Science - Final Project
Project title: Using Machine Learning to Estimate the Energy Performance of Residential Buildings

In this project, I used geographic features to predict the energy efficiency of residential buildings which are characterized by heating and cooling loads. I went through standard procedure for machine learning projects, from exploratory data analysis to machine learning pipeline for hyper-parameter tuning and cross-validation, and finally global and local feature importance analysis.
The final report for this project can be found here and project code is available on github.
Data Engineering - Final Project
Project title: US Covid-19 Tracker
Team “Old Boys” members: Cheng Zeng (Leader), Tianqi Tang, Zhi Wang
About
This web application is available on github here. It can be run on a cloud web development environment gitpod or you can run it locally with the notebook Local_Dash.ipynb. Note that you need to install the python packages listed in requirement.txt first.
- Project & Executive Summary
- We will create a live data-science web application named “Covid-19 tracker”. It uses covid-19 data from the New York Times to understand and project the spread of the outbreak in the United States at hierarchical granularity, ranging from national to county level. It will allow users to interactively view the covid cases and death at different levels.
- This final project uses gitpod as the platform, an online IDE for github repo for data collection, clean-up, transformation and visualization. The data will be stored in Mongodb, through the adaptor of a python module named “pymongo”. The EDA, visualization and enhancement will be in jupyter notebooks. The interactive web application will be realized using plotly and Dash. It will mainly comprise three sections, namely Introduction, EDA & Visualization and Enhancement. The enhancement section is aimed at figure out whether two factors of interest might affect the transmission in states, and also a simple regression model is constructed to project the trend of the pandemic in US.
- At the end of this project, we hope to build up a web application which tracks the up-to-date Covid-19 situation at various geographical levels. Meanwhile it aims to provide some insights on if restrictions, such as wearing masks, can help to contain the pandemic.
- Datasets used:
- The covid national-level and state-level datasets are from The New York Times, based on reports from state and local health agencies. They contain a series of data files with cumulative counts of coronavirus cases in the United States, at the national and state level, over time. They are regularly updated every day. The national level data is about 7 KB. The state level data is 463 KB. The covid datasets are scaped from the github repo of New York Times. These are raw texts that can be retrieved in a straightforward way using the “request” python module. The raw data will be updated every day. So the incremental updates using the web scraping method will be done automatically.
- The static survey data regarding the propensity to wearing masks (109 KB), state-level population data (1 KB), and state area data (884 B) are used to understand how the role of wearing face coverings and population density in the course of the pandemic.
- Summary of performance with respect to the baseline model(s)
- We figure out that there is a strong correlation between infection rate and population density in US states.
- There exists a high negative correlation between the propensity to wear masks and the case fatality rate in states.
- In the next steps, we aim to build a simple regression model to predict the trend of outbreak in US. We use the historical covid data and demongraphic featurs ad predictors, and we target on prediction of near-future case and death count.
Project Architecture
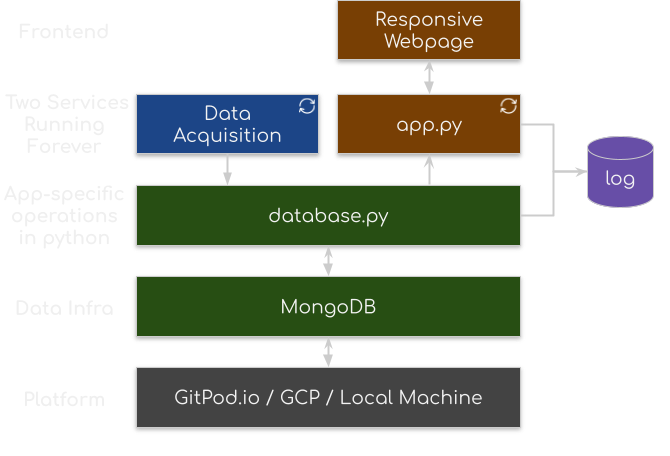
This project uses MongoDB as the database. All data acquired are stored in raw form to the database (with de-duplication). An abstract layer is built in database.py so all queries can be done via function call. For a more complicated app, the layer will also be responsible for schema consistency. A plot.ly & dash app is serving this web page through. Actions on responsive components on the page is redirected to app.py which will then update certain components on the page.

Data and Society - Final Project
Project title: AI’s Ethical Place in Criminal Justice: An Analysis and Case Study of COMPAS and the Ethics of Pre-Trial Computer-Aided Decision Tools
Team Members: Ben Xiong, Jillian Green, Christopher Rohlicek, Akshay Shah, Qingyan Guo, Cheng Zeng, Emmanuel Peters (No author order preference)

The rule of law is the fundamental ethical underpinning of society, and like all aspects of modern life our conception of law and justice is being challenged by the increased role that technology is playing, and how it should be used as we move into the future. Artificial intelligence (AI) has grown to a point where it has presented solutions to a wide array of problems that throughout history have been imagined to be the necessary domain of humans. As so many tasks are now seeming like they can be automated or assisted by machines, we as ethicists need to take a careful look at what we are asking machines to do for us, and what we are sacrificing by having them do it. In this final project, we discussed Roles of AI & human beings in the judicial system, Risks of Overuse of AI, Ethical Perspectives, COMPAS (Correctional Offender Management Profiling for Alternative Sanctions) algorithmic systems, Algorithm Fairness & Biases, and our recommended solutions & limitations.
Statistical Learning - Final Project
Project title: African Economic Crisis Analysis: Informative Indicators for Crisis
Team Members: Hanxiao Chen, Zeyan Du, Yiwei Sang, Zhi Wang, Cheng Zeng, Yue Zhuang

In this project, we explored different statistical learning methods applied to the African Economic Crisis dataset, including basic logistical regression, model with engineered features, model with time-series features, and multilevel models. We identified the informative indicators for systemic crisis and currency crisis using comprehensive statistical plots such as residual plots, confusion matrix, and ROC curves.